Hello, it’s Mamish!
Today, I’m sharing more of what I’ve learned about stock investment. ٩(*°ꇴ °)۶ nice!
Today’s topic is about when to buy stocks.
I’m sure if you’ve started investing in stocks, you might be wondering, “So…when’s the best time to buy?”
And while you’re debating this, the stock price for your favorite picks might keep climbing until you miss the opportunity entirely… 😢
Or, maybe you’ve thought, “This stock looks like it’s on an upward trend!” bought it quickly, and then watched it fall. Oops! 😅
So let’s learn about timing for buying stocks so that we avoid those situations!
Two Analyses Needed When Buying Stocks
To pick the best time to buy stocks … Technical Analysis
Use charts to judge buying points.
To pick the best stocks to buy … Fundamental Analysis
Look into a company’s performance to decide if it’s worth investing in.
Today, I’ll talk about what I’ve learned about technical analysis!
What is a Chart?
Have you seen a stock chart before?

Here’s an example
Stock charts show price trends over different periods, like daily, monthly, or yearly.
In the example chart, you can see it’s in an overall uptrend, despite occasional dips.
The bars that look like little hotdog sticks below the line chart are called candlesticks.
Pretty literal, huh?
I’ll explain candlesticks more another time!
Spotting Stock Price Trends
There are three basic types of trends.
Let’s draw trend lines by connecting highs with highs (resistance) and lows with lows (support), as shown in the chart below.
- Uptrend (upward trend line): Stock prices are on an upward trend.
- Consolidation (sideways trend line): Stock prices are going up and down within a certain price range.
- Downtrend (downward trend line): Stock prices are on a downward trend.
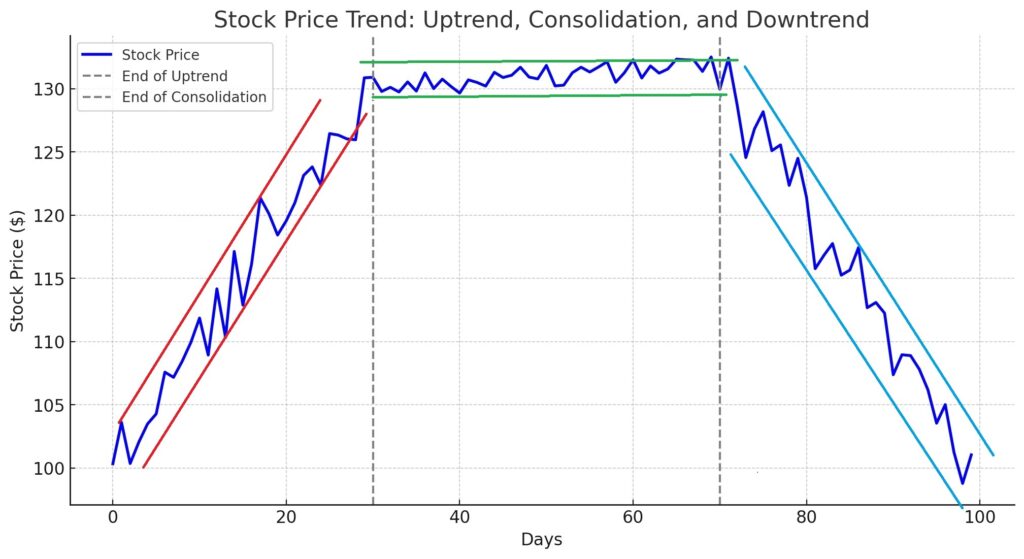
One thing to keep in mind: this chart represents 100 days, but charts come in various timeframes, such as short-term (1–3 months), medium-term (6 months to 1 year), and long-term (2 years, 5 years, etc.).
You need to look at charts that match the time you plan to hold a stock.
A 100-day chart is only a part of the big picture.
Over a longer period, you may see repeated “upward, sideways, downward” patterns, with a gradual rise or fall overall.
Timing for Buying Based on Each Trend

《Buying Point 1 (Uptrend)》
①Pullbacks: Connect points where prices dipped (marked with red circles), predict the next pullback, and place a limit order (an order to buy at a specific price).
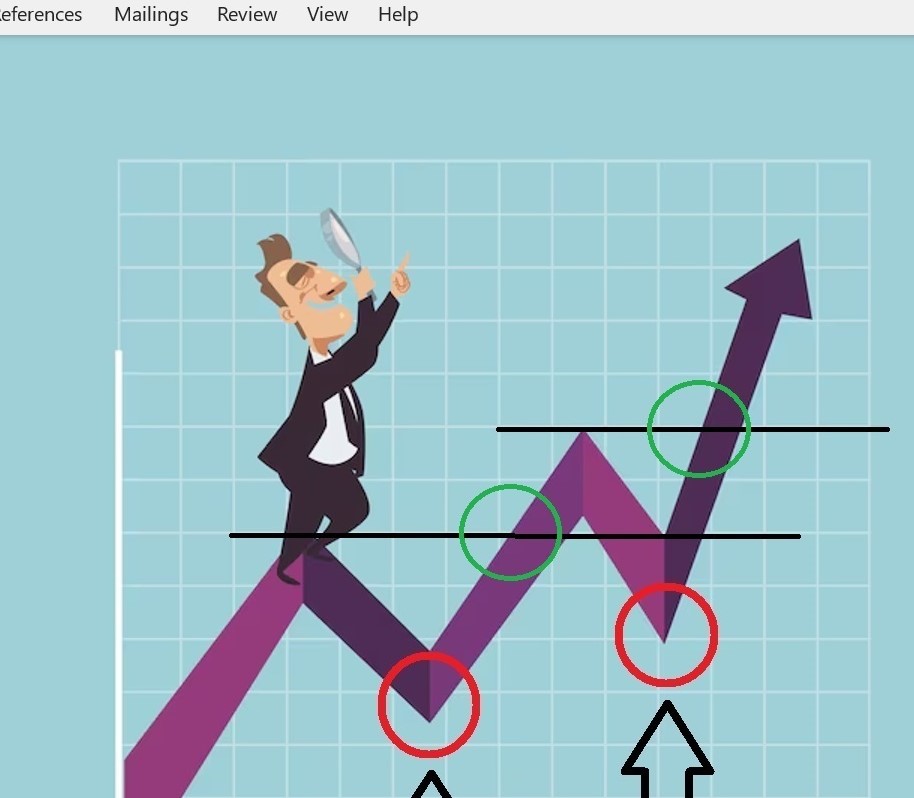
②Breakout Above Previous High: Draw a horizontal line at a previous high and buy when the price breaks above this point (marked with a green circle).
However, if the price keeps rising without pullingbacks, this strategy might not work …
They say, “No pullback when waiting for one,” so sometimes, you need to just go for it!
《Buying Point 2 (Consolidation)》
①Breakout from Consolidation: In a sideways trend, buy when the price breaks above the range.
This is often a big opportunity because of the buying pressure!
②Range Bottom: In a consolidation trend, buy at the lower end of the range and sell quickly at the upper end. Short-term and tricky for beginners!
③Triangle Breakout: When a triangle pattern forms with highs and lows converging, buy when the price breaks out upward.
But beware! Sometimes, this breakout can quickly reverse (a “fake-out”).
《Buying Point 3 (Downtrend)》
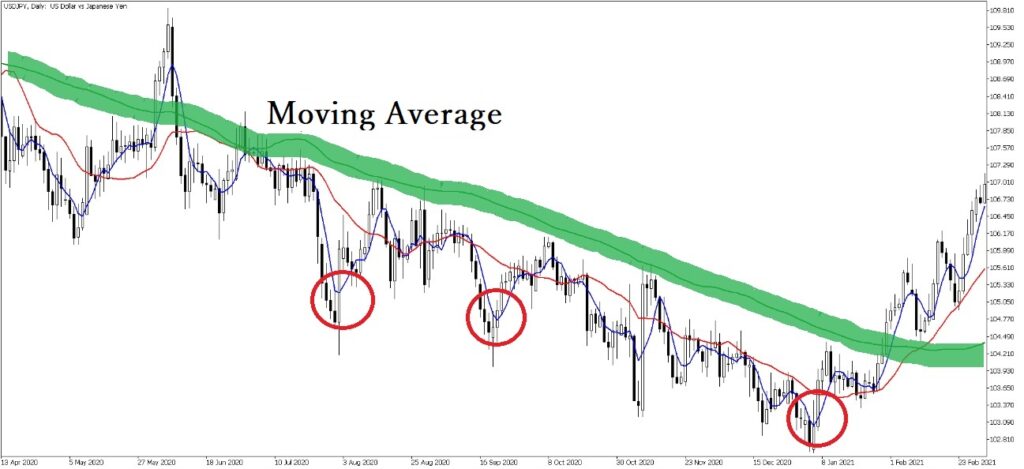
①Deviation from Moving Average: The green line in the chart is the moving average, showing the average price over a set period.
When the price deviates significantly (like at the red circle), it’s considered a buy signal because prices often try to return to the average.
However, prices may drop again, so know when to sell!
②Double Bottom Breakout
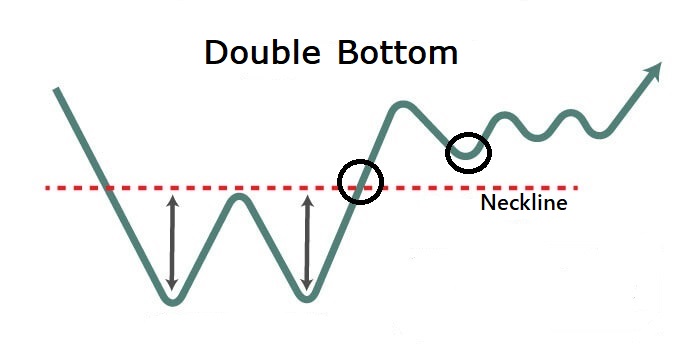
When prices create a W shape, the breakout above the “neckline” after the second low (marked with a black circle) is a buy signal.
If the price holds above this level, it’s a good buy!
Don’t buy when it’s falling! (Buy only after confirming that it has bottomed out)
Don't touch a falling knife
Final Advice☝For beginners, it’s safer to buy in an uptrend rather than in consolidation or a downtrend.
Watch the Volume
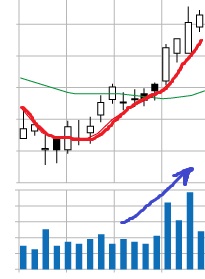
Volume shows the level of interest in a stock, represented by the blue bars.
If both the price and volume are increasing (as with the red line), it’s generally a good sign to buy.
Summary
Today, we’ve learned about buying timing for stocks.
But most investors agree: “Nobody knows the future.”
So sometimes, taking a leap is necessary.
For now, consider buying a well-known stock with good performance.
From there, keep learning and gradually build your portfolio.
I’m still a beginner, and my brain feels fried just writing this! ( •᷄◡̑•᷅ ) Whew!
Let’s study together again!
See you soon👋


